STEM Thursday, Kostoryz Elementary, March 3rd, 2016
Presenters: Dr. Bruun, Mr. Moreno, Ms. Stephens

Taste the Rainbow Lesson Plan
Engage
How can we use graphs to display data?
Graphing Powerpoint
Explore
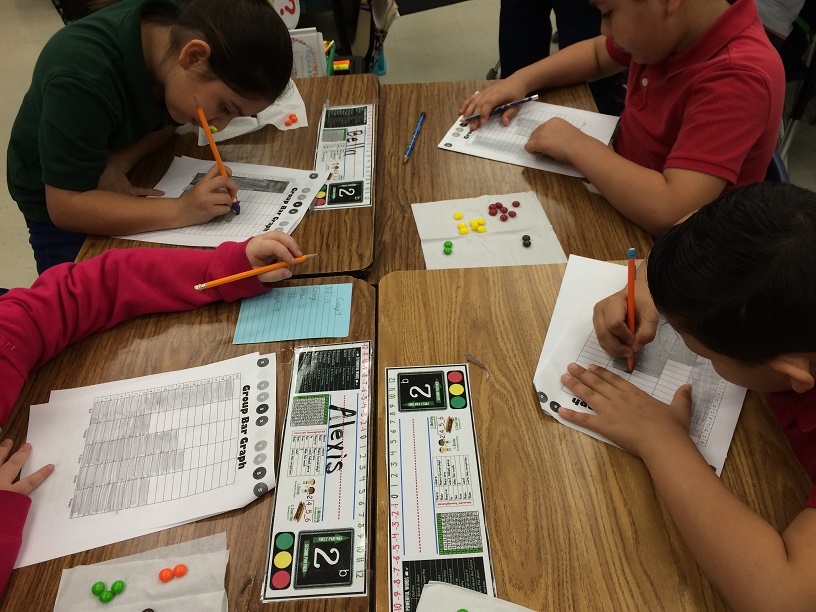
Skittles Graphing Student Packet
Let’s make predictions!
-
How many skittles are in one fun size pack?
Explain
-
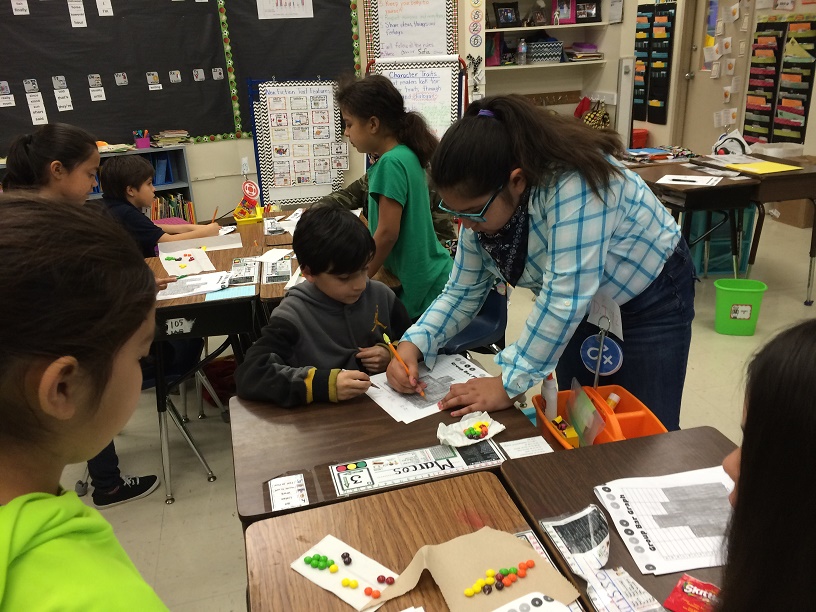
How can we predict how many skittles in our small group?
-
How many red Skittles do we predict will be in our small group?
-
How can a dot plot help us to organize our data?
-
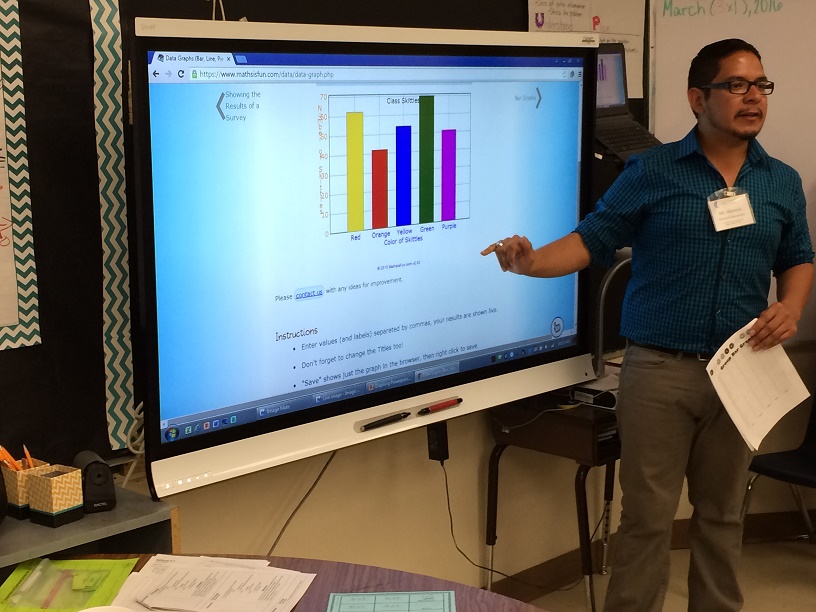
Online Graph Maker

Elaborate
-
How can we predict how many skittles in our whole class?
-
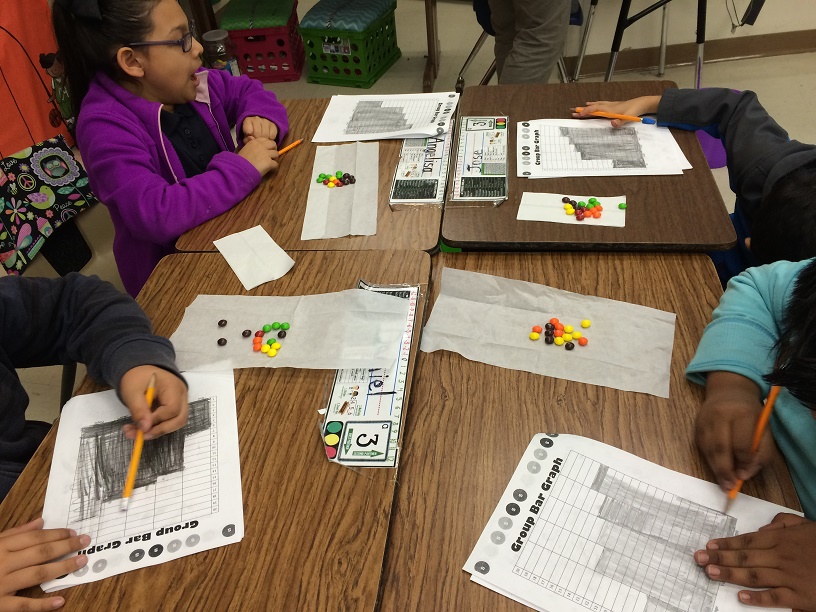
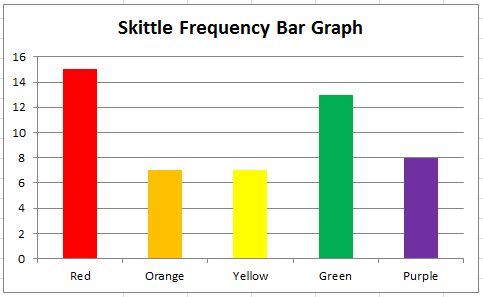
How can a bar graph help us to organize our data?
-
How can a pictograph help us understand our data?
-
What color Skittle was there the most of? the least?
-
What was the difference between the color with the largest number and the color with the smallest number?
Evaluate
Graphing Evaluation Powerpoint