I worked with Blue Crab Toxicology.
This log will represent my experience over the whole summer.

Adult blue crab in large glass bowl

Lisa Coates measuring out salt water.
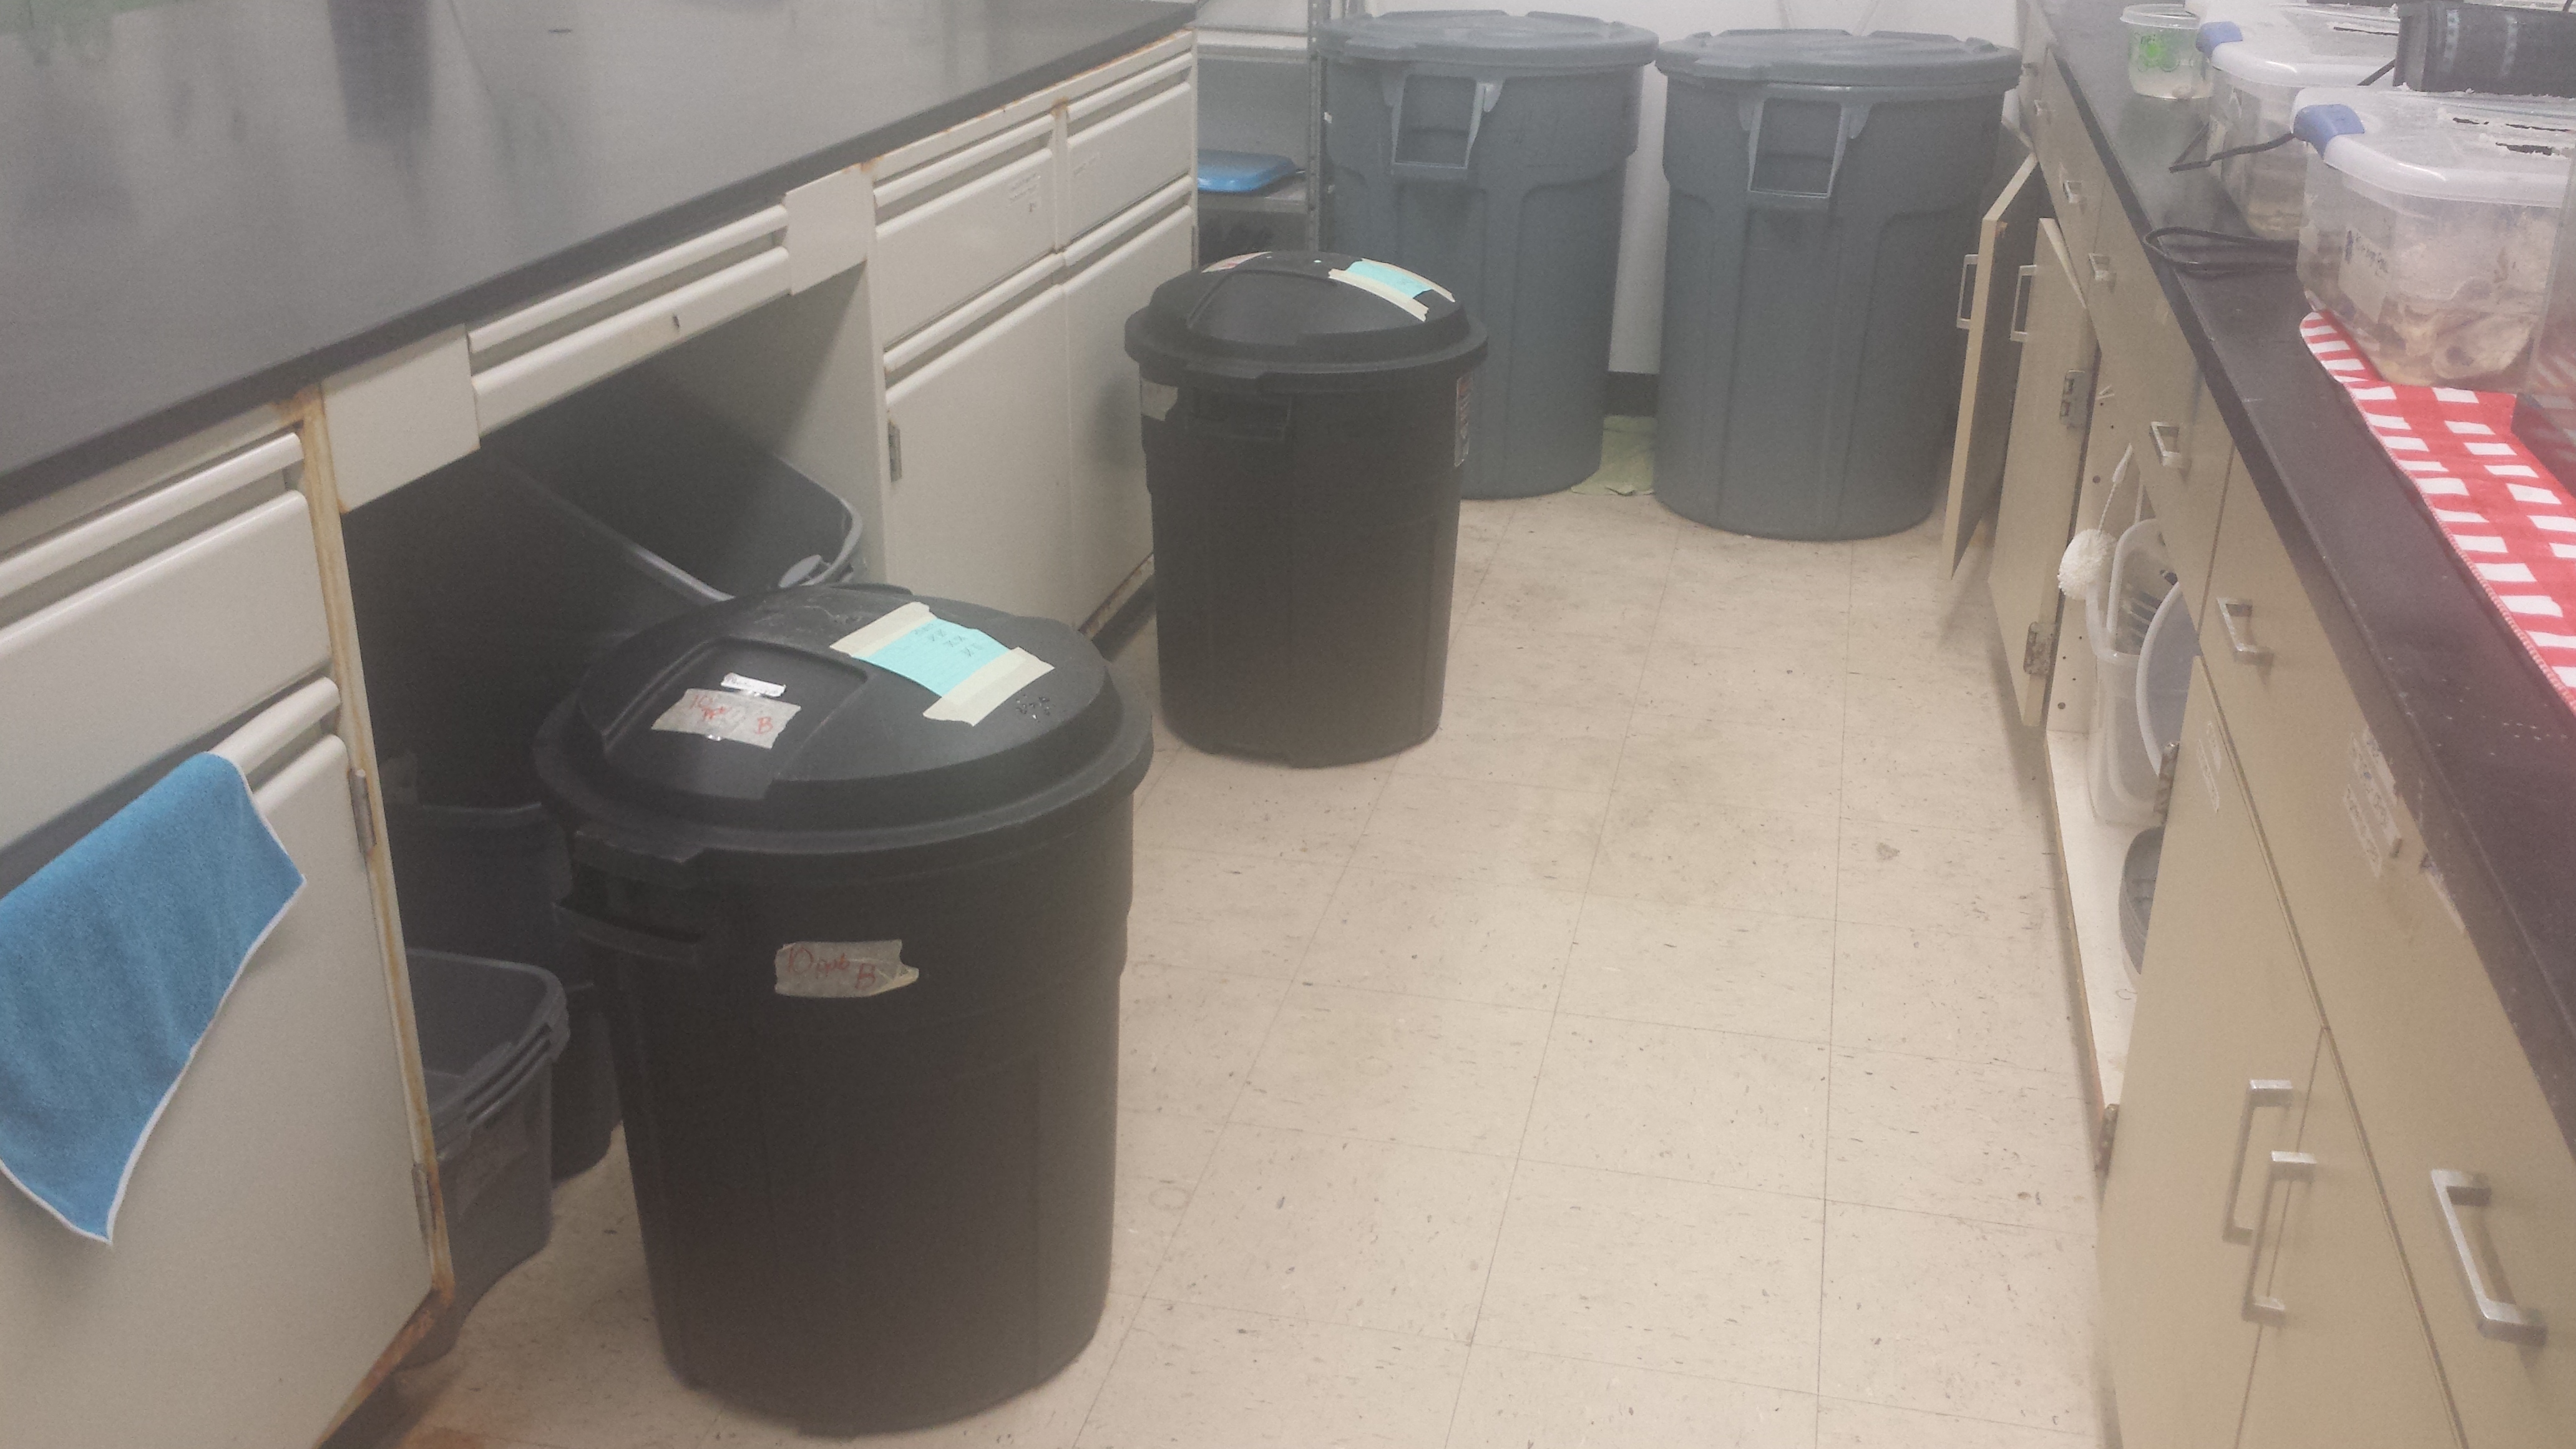
Small trash cans with exact measurement of malathion to salt water used for the experiment.
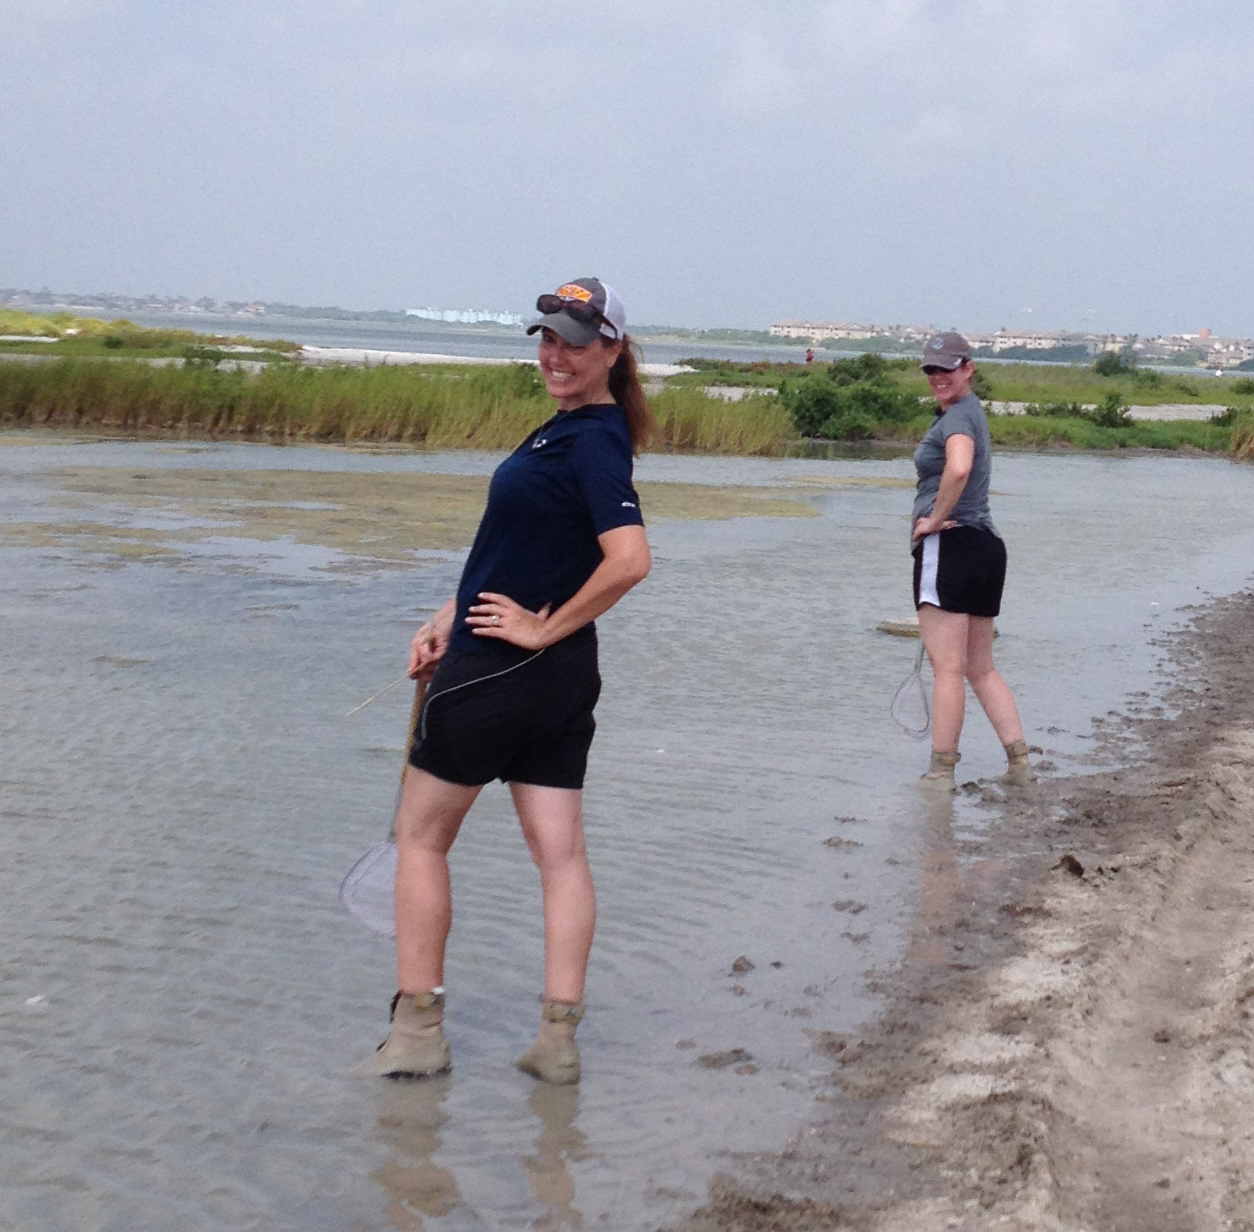
Keeping the humor going while crabbing, Strike that pose!

Adult sorting tanks

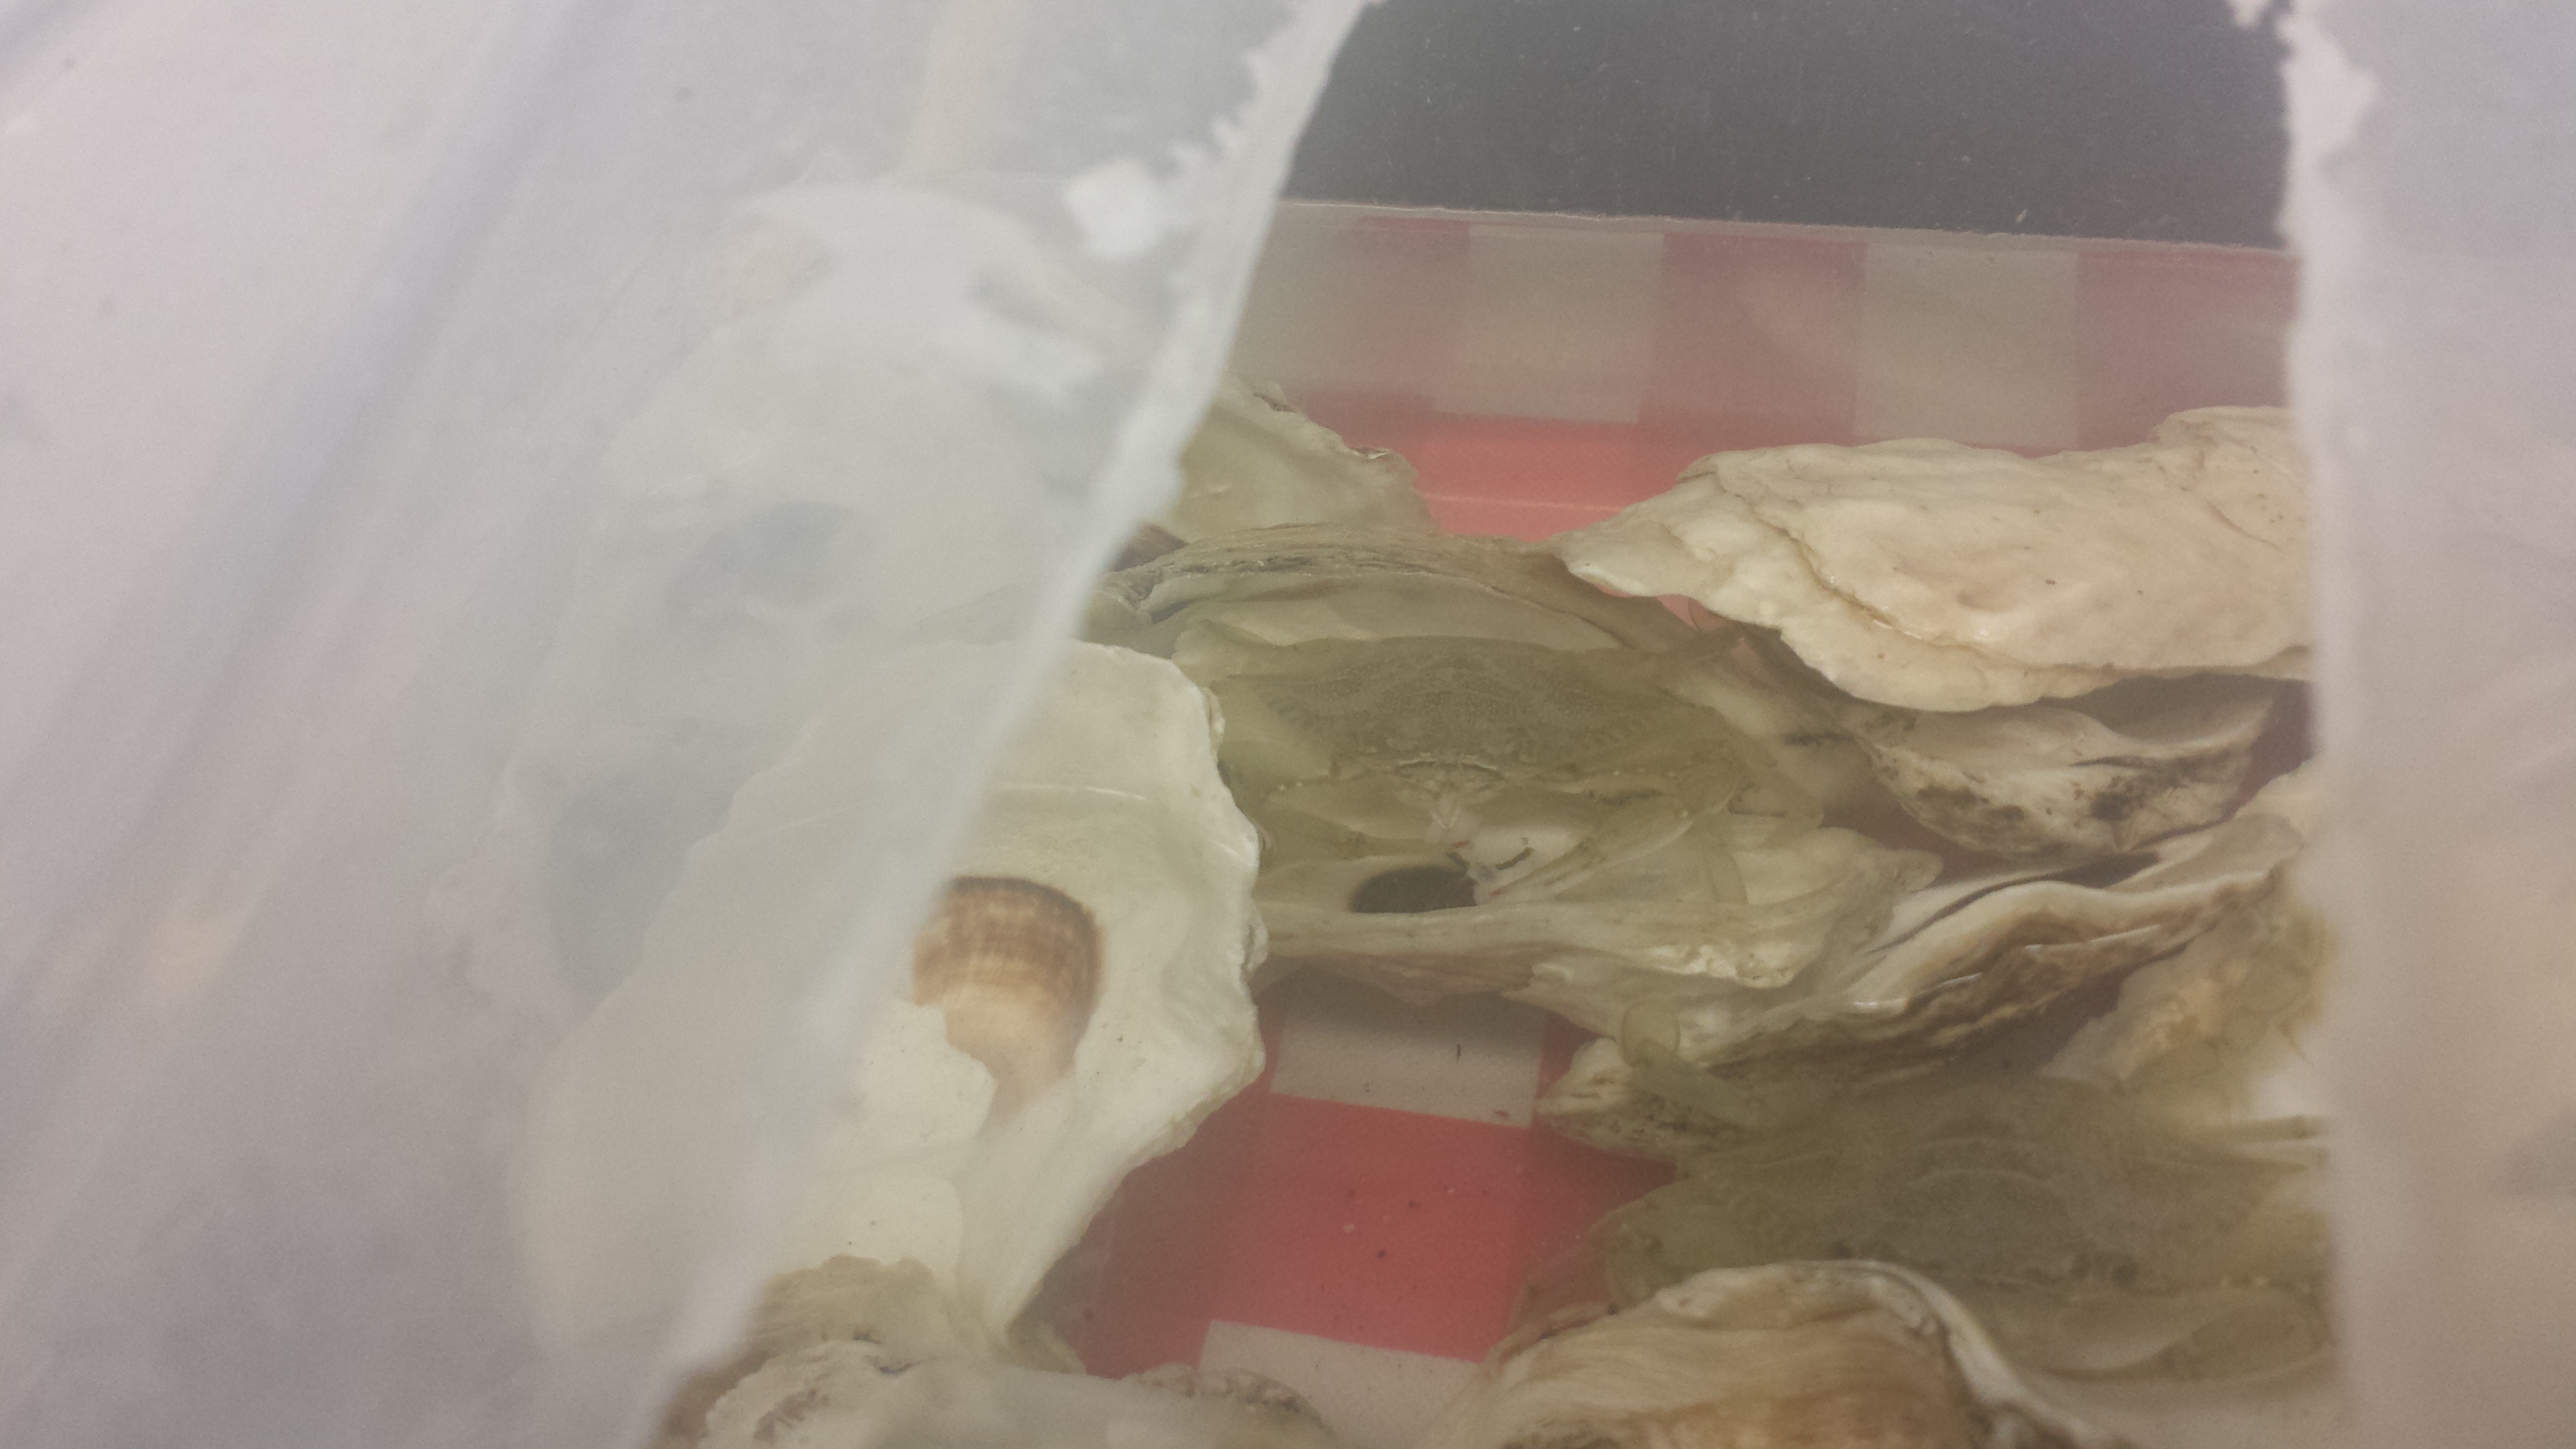
Juvenile crab hiding in an oyster.

Measuring crab
Who We Are
What We Did
I enjoyed every second of my summer! Some days were spent cleaning large glass bowls or small glass bowls which was not an easy task but was important. The bowls were the homes for the crabs during there experiment. All bowls needed to be cleaned 3 times each then dipped into an acid bath for 2 hours then rinsed again before they were considered clean. A portion of the crabs were considered the controls which meant that their water did not have anything added to it (just plain salt water). The other portion of the crabs were given salt water that had a ratio of 50 microliters malathion per liter of salt water. The making of the salt water was another fun task that I pretty much mastered. Large trash cans were filled with regular tap water. A dechlorinator was added to the water. Then salt crystals were added until the correct salinity was reached (18 – 20ppm was the goal salinity). A refractometer was used to measure the salinity of the water. Always make sure to log any chemicals that were placed in the water. Then very carefully the salt water was measured out into smaller trash cans so that Kelly could have the correct malathion to salt water ratio (Do Not Loose Count!). Now before the experiment could start, the truly fun part occurred we got to collect the crabs (aka crabbing). This was an all day affair that included a ruler to measure the crabs to make sure they were the right size, chicken neck (to attract the crabs), and fishing line which was tied to the ruler and the chicken. Oh and do not forget the net to scoop up the crabs once they came over to nibble on the chicken. Two different sizes were needed for the experiment. A juvenile which had a range of 2-4cm and adults.
What We Learned
Control crabs vs 3 different sets of crabs that the pesticide (malathion) was added to the water. One group of crabs were only dosed one time, another group was dosed two times and one group only had a very short time of dose. The different times allow Kelly to see how much exposure it takes for the crabs to start having slower response times. It was amazing to watch the testing of the responses. Kelly would flip the crab onto its’ back and then time how long it would take for the crab to right itself. She had a rating system for how the crab responded to being flipped over as well. She also tested the crabs eyes for response to movement (did the eyestalks retract quickly). Once the exposure time was over then it was off to the hatchery to see how the crab responded finding food.
Not only did I learn correct lab protocol and cleanliness, but I learned how we are affecting the crabs and marine wildlife. Malathion is the same pesticide used to protect the city from mosquitos and is also used by farmers on the fields.
Questions We Have
Does the pesticide affect the response times of the crabs. Although her research is not yet complete. She is already seeing trends in that data that support response times are slower when in pesticide waters.
I had asked Kelly if the crabs can see color. In the lab different color spatulas were used to test the eye responses. The different colors were to keep the control spatula separate from the spatula that goes into the crabs with pesticide. If they could see color, this could have affected her research.
Connections to Teaching
This connects to the students learning about ground water. How water flows into the rivers and bays nearby.
At the beginning of the year students are taught how to collect data, read and interpret data and make tables. This is the perfect experience for this type of lesson.