Author(s)
Introduction
Oyster reefs are a very important part of our ecosystem. They help reduce the amount of erosion caused by the ocean, creating a natural barrier between the rising ocean tides and the land that people have homes on. They also contribute to improved water quality by filtering pollution from the ocean water. Oyster reefs are also the homes of many small ocean creatures, as well as the prey for fish and blue crab. However, increased water turbidity may be affecting the types of communities that are living in and feeding off of oyster beds. Turbidity is the cloudiness or haziness in a fluid caused by large particles in the water. If scientists can find out if turbid water increases or decreases the amount of oyster reefs and the types of predators that are in oyster reefs in each type of water, it would help them to decide if human made turbid waters are harming the environment.
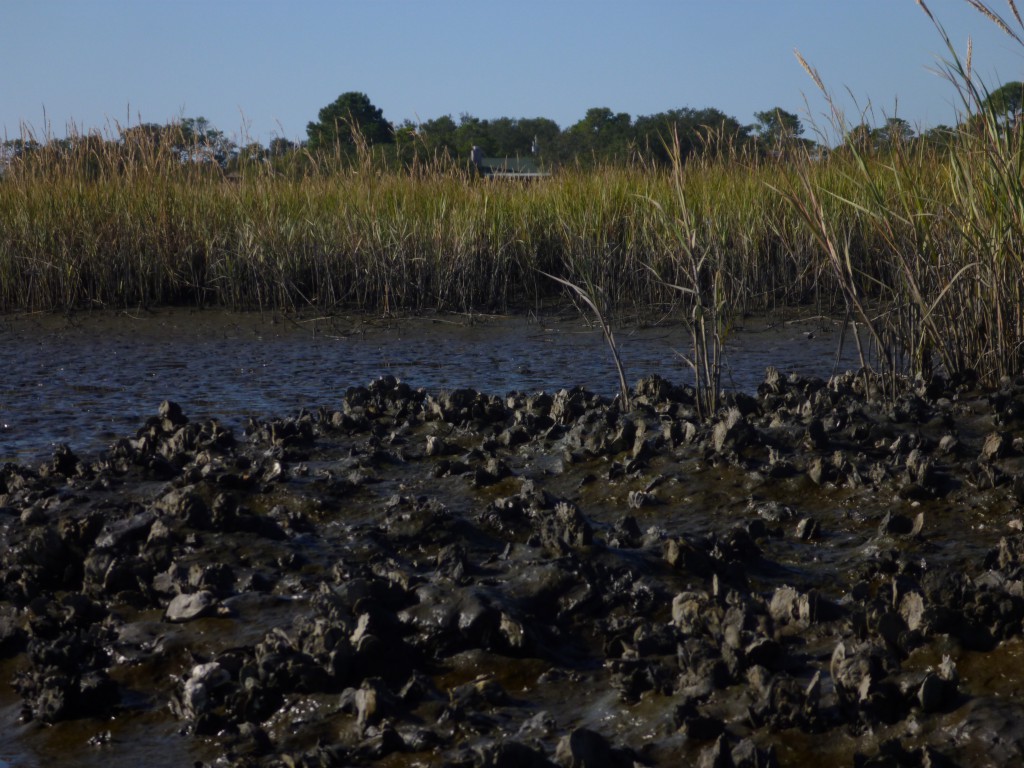
Oyster reef near Corpus Christi Bay.
This summer, I was part of a team of scientists whose task was to gather data and information at several sites in the Gulf of Mexico using scientific tools. The research question that the scientists are trying to find data on is: What is different about the types of communities that live in oyster reefs that are in turbid waters as opposed to clear waters?
Elementary school students would find this investigation valuable because they will learn about communities, predator-prey relationships, and the effect of the environment on organisms.
Methods & Procedures
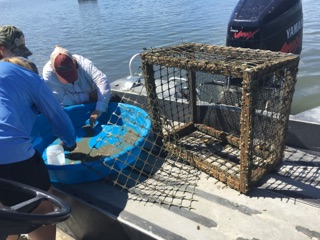
We went out on a boat into the bay in order to collect data from 30 different sites. We were able to locate these sites by following a GPS and looking for 3 long poles made of PVC pipe. These poles showed the location of 3 cages. At each site, one cage was completely open. Another cage had large openings in it. The last cage had small openings in it. The purpose of this was to compare which predators of varying sizes would live near the oyster reefs.
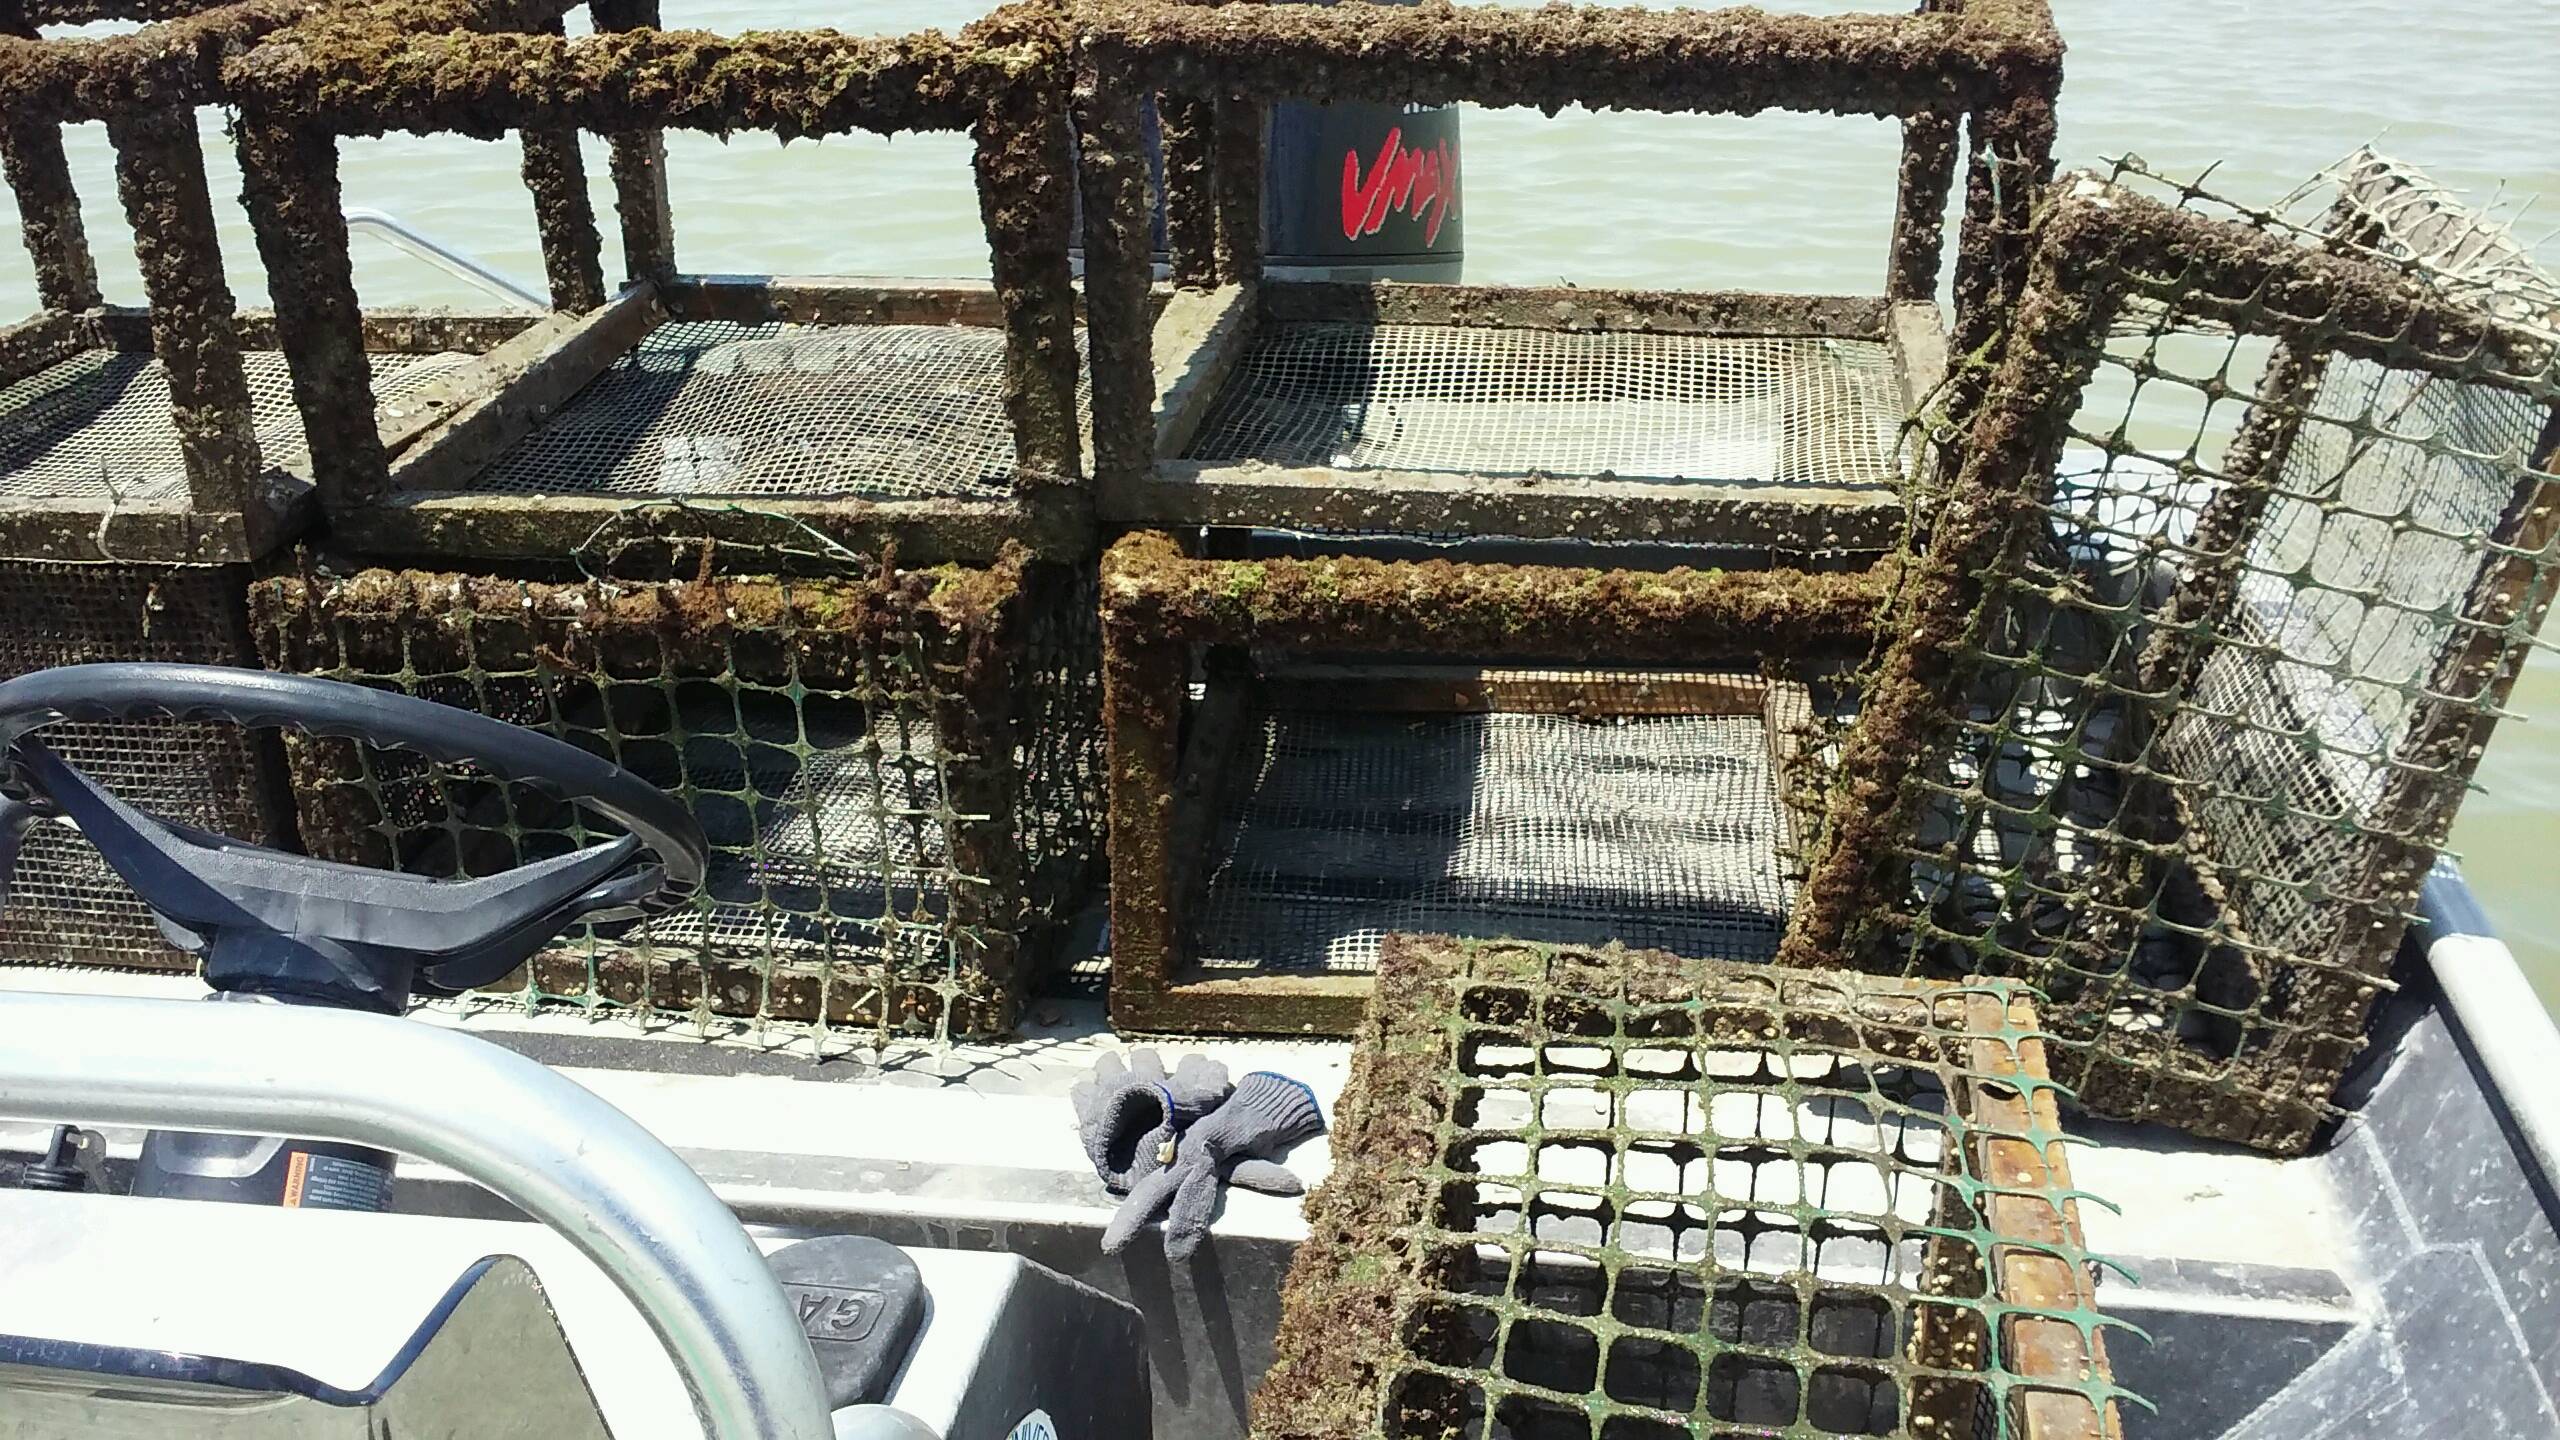
These are the cages that were in the bay. Some have large openings, while others had small or medium openings to let different sized predators into the oyster reef.
Once we found the site, one of us would hop out to get a secchi disk measurement. The secchi disk is used to measure the transparency of the water which indicates the turbidity of the water in that area. The secchi disk is a round black and white patterned tool attached to a rope. The scientist lowers it into the water until the pattern is no longer visible. At that point, the scientist pinches the rope at the water line and brings the disk back up. The scientist then measures the length of the rope from the disk to the water line. This is the secchi measurement. Secchi measurements were taken at each site in order to keep track of which sites were to be considered “turbid” and which sites were to be considered “clear”. The scientists will then use this data to compare the communities in different sites.
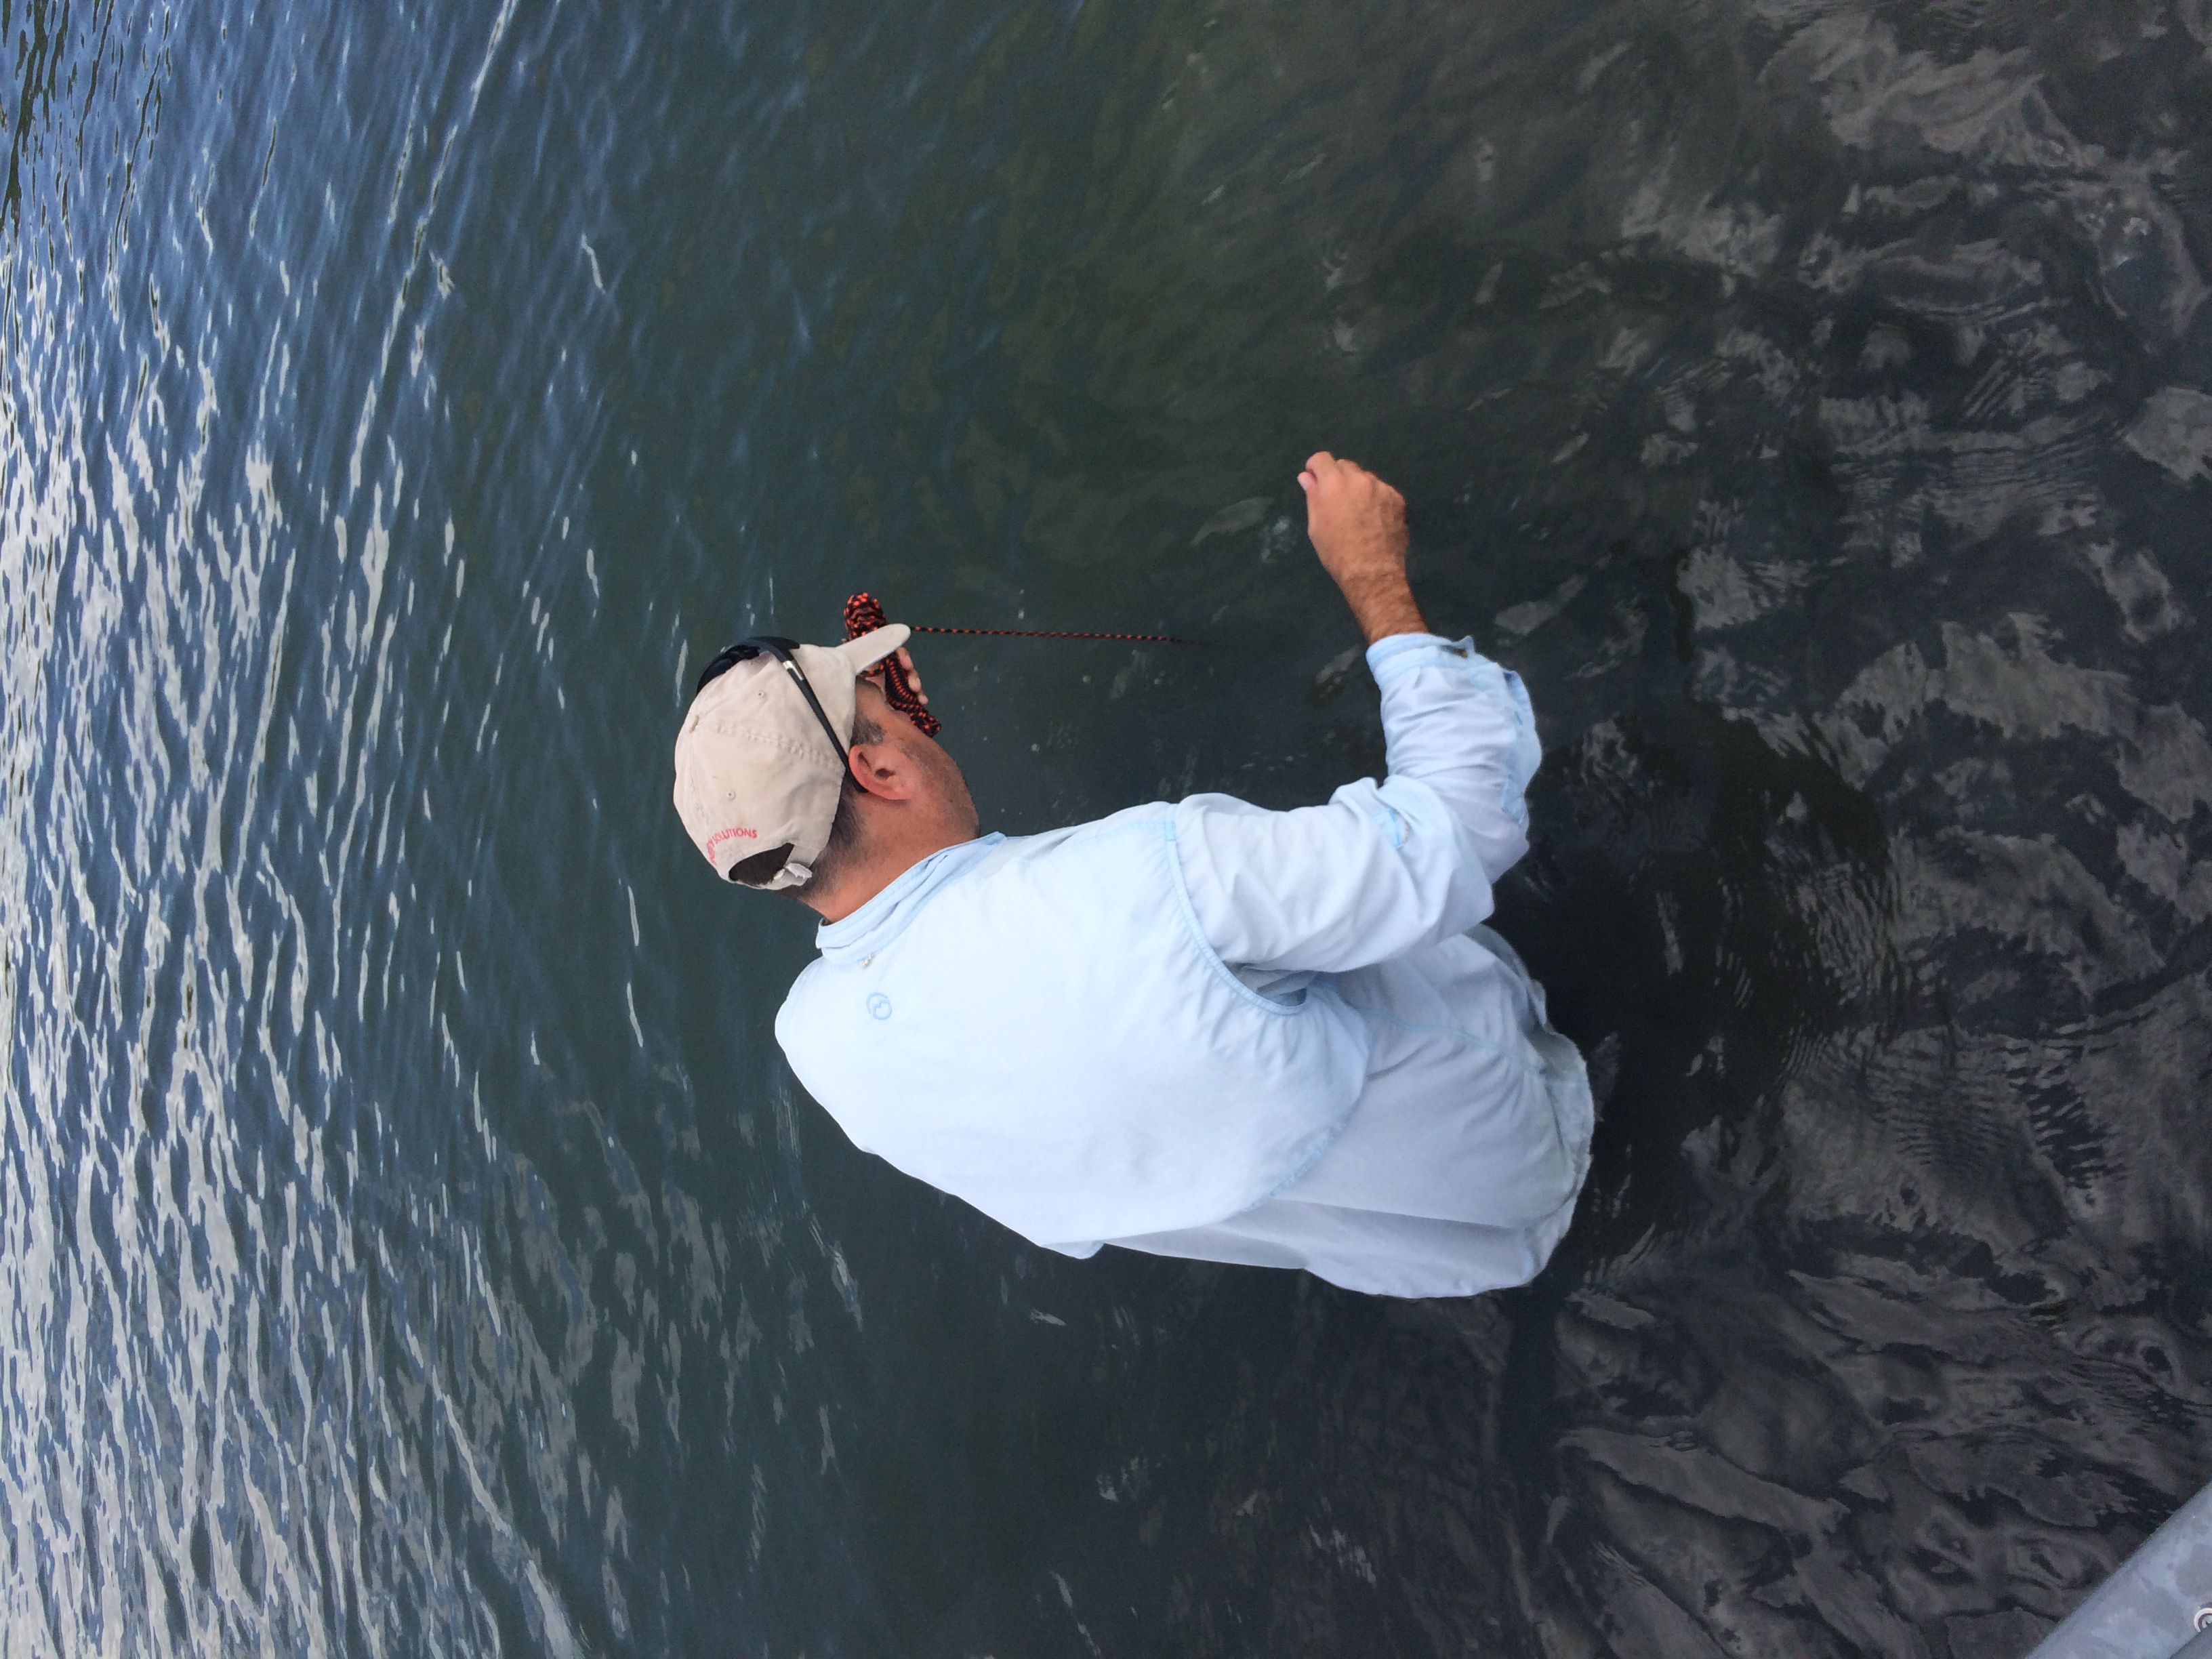
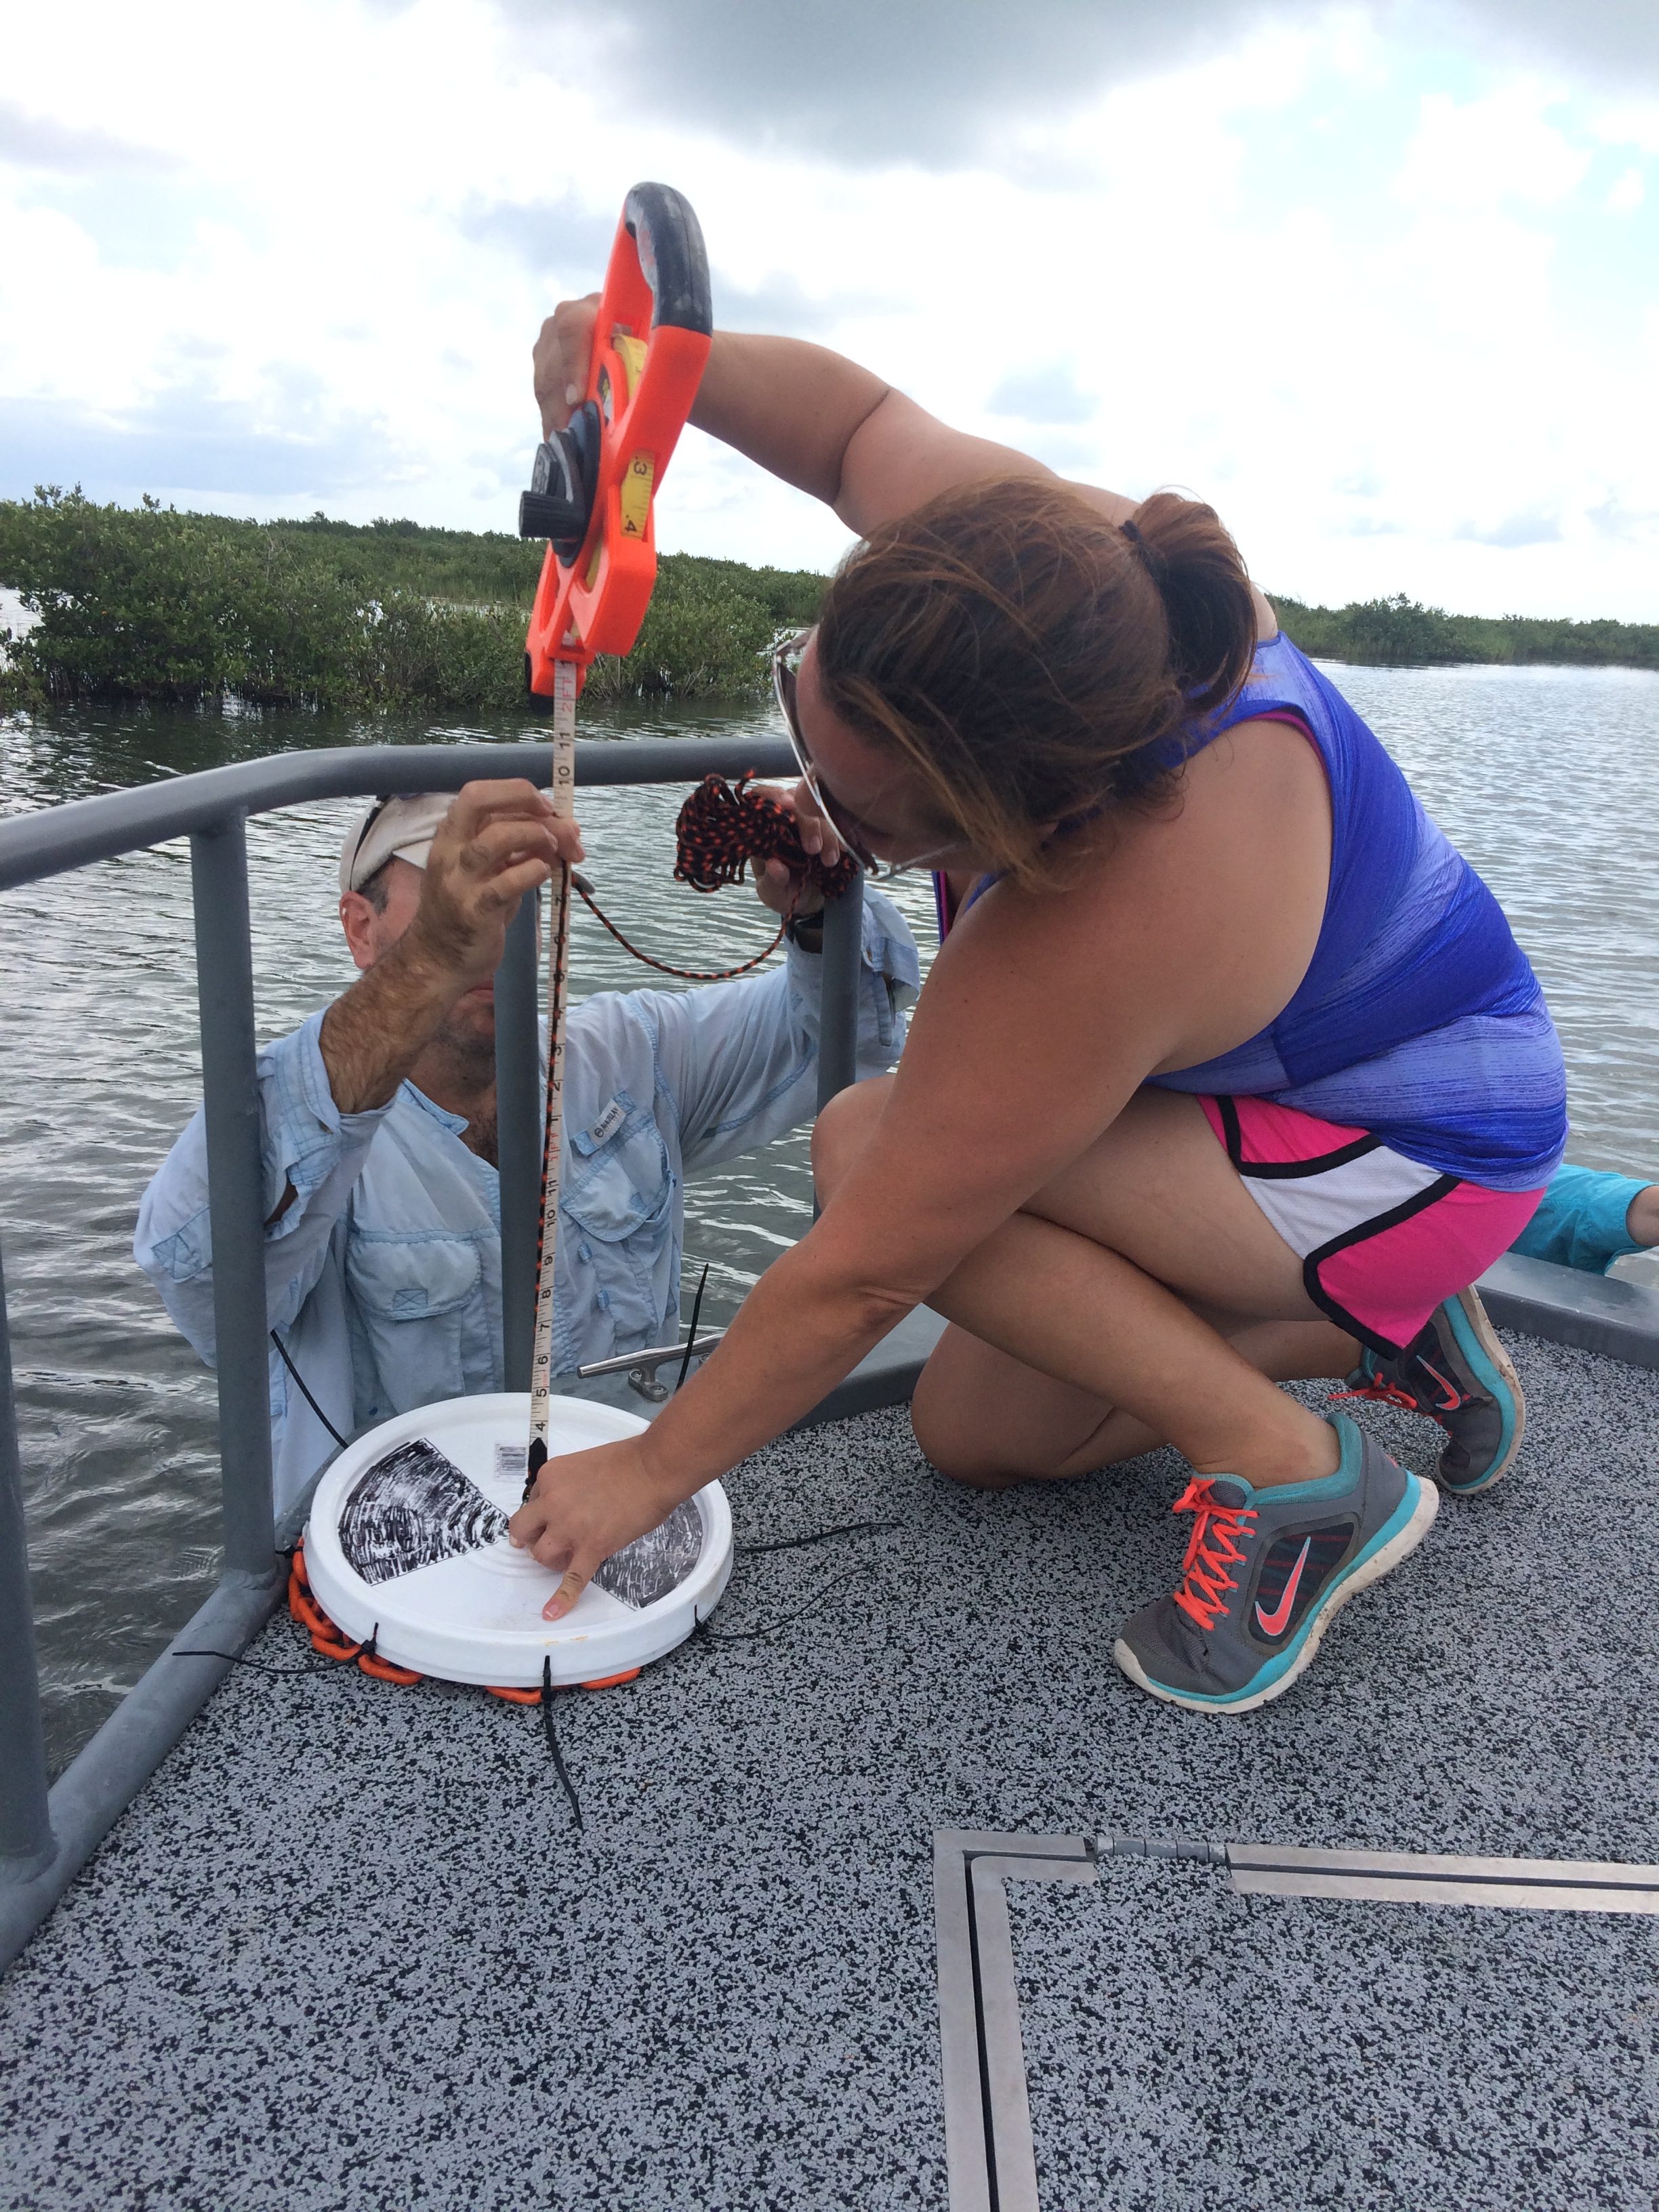
This is a picture of Dr. Smee pinching the rope at the water line at the point where the pattern on the Secchi Disk disappears. The second picture is how the Secchi Disk measurement is conducted.
We also measured the salinity in each area using a refractometer. A small amount of water is placed on the clear lens of the refractometer. Then the scientist holds it up to the light and looks into it. A line will appear near the number of parts per thousand to show the salinity level. The salinity was measured in order to see if it affected the types communities in different sites.
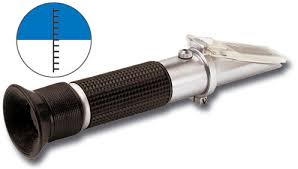
Refractometer
Data loggers which are electronic data collectors were also cleaned and added to some of the sites. I collected all of the data on secchi measurement, salinity, and data loggers in a notebook.
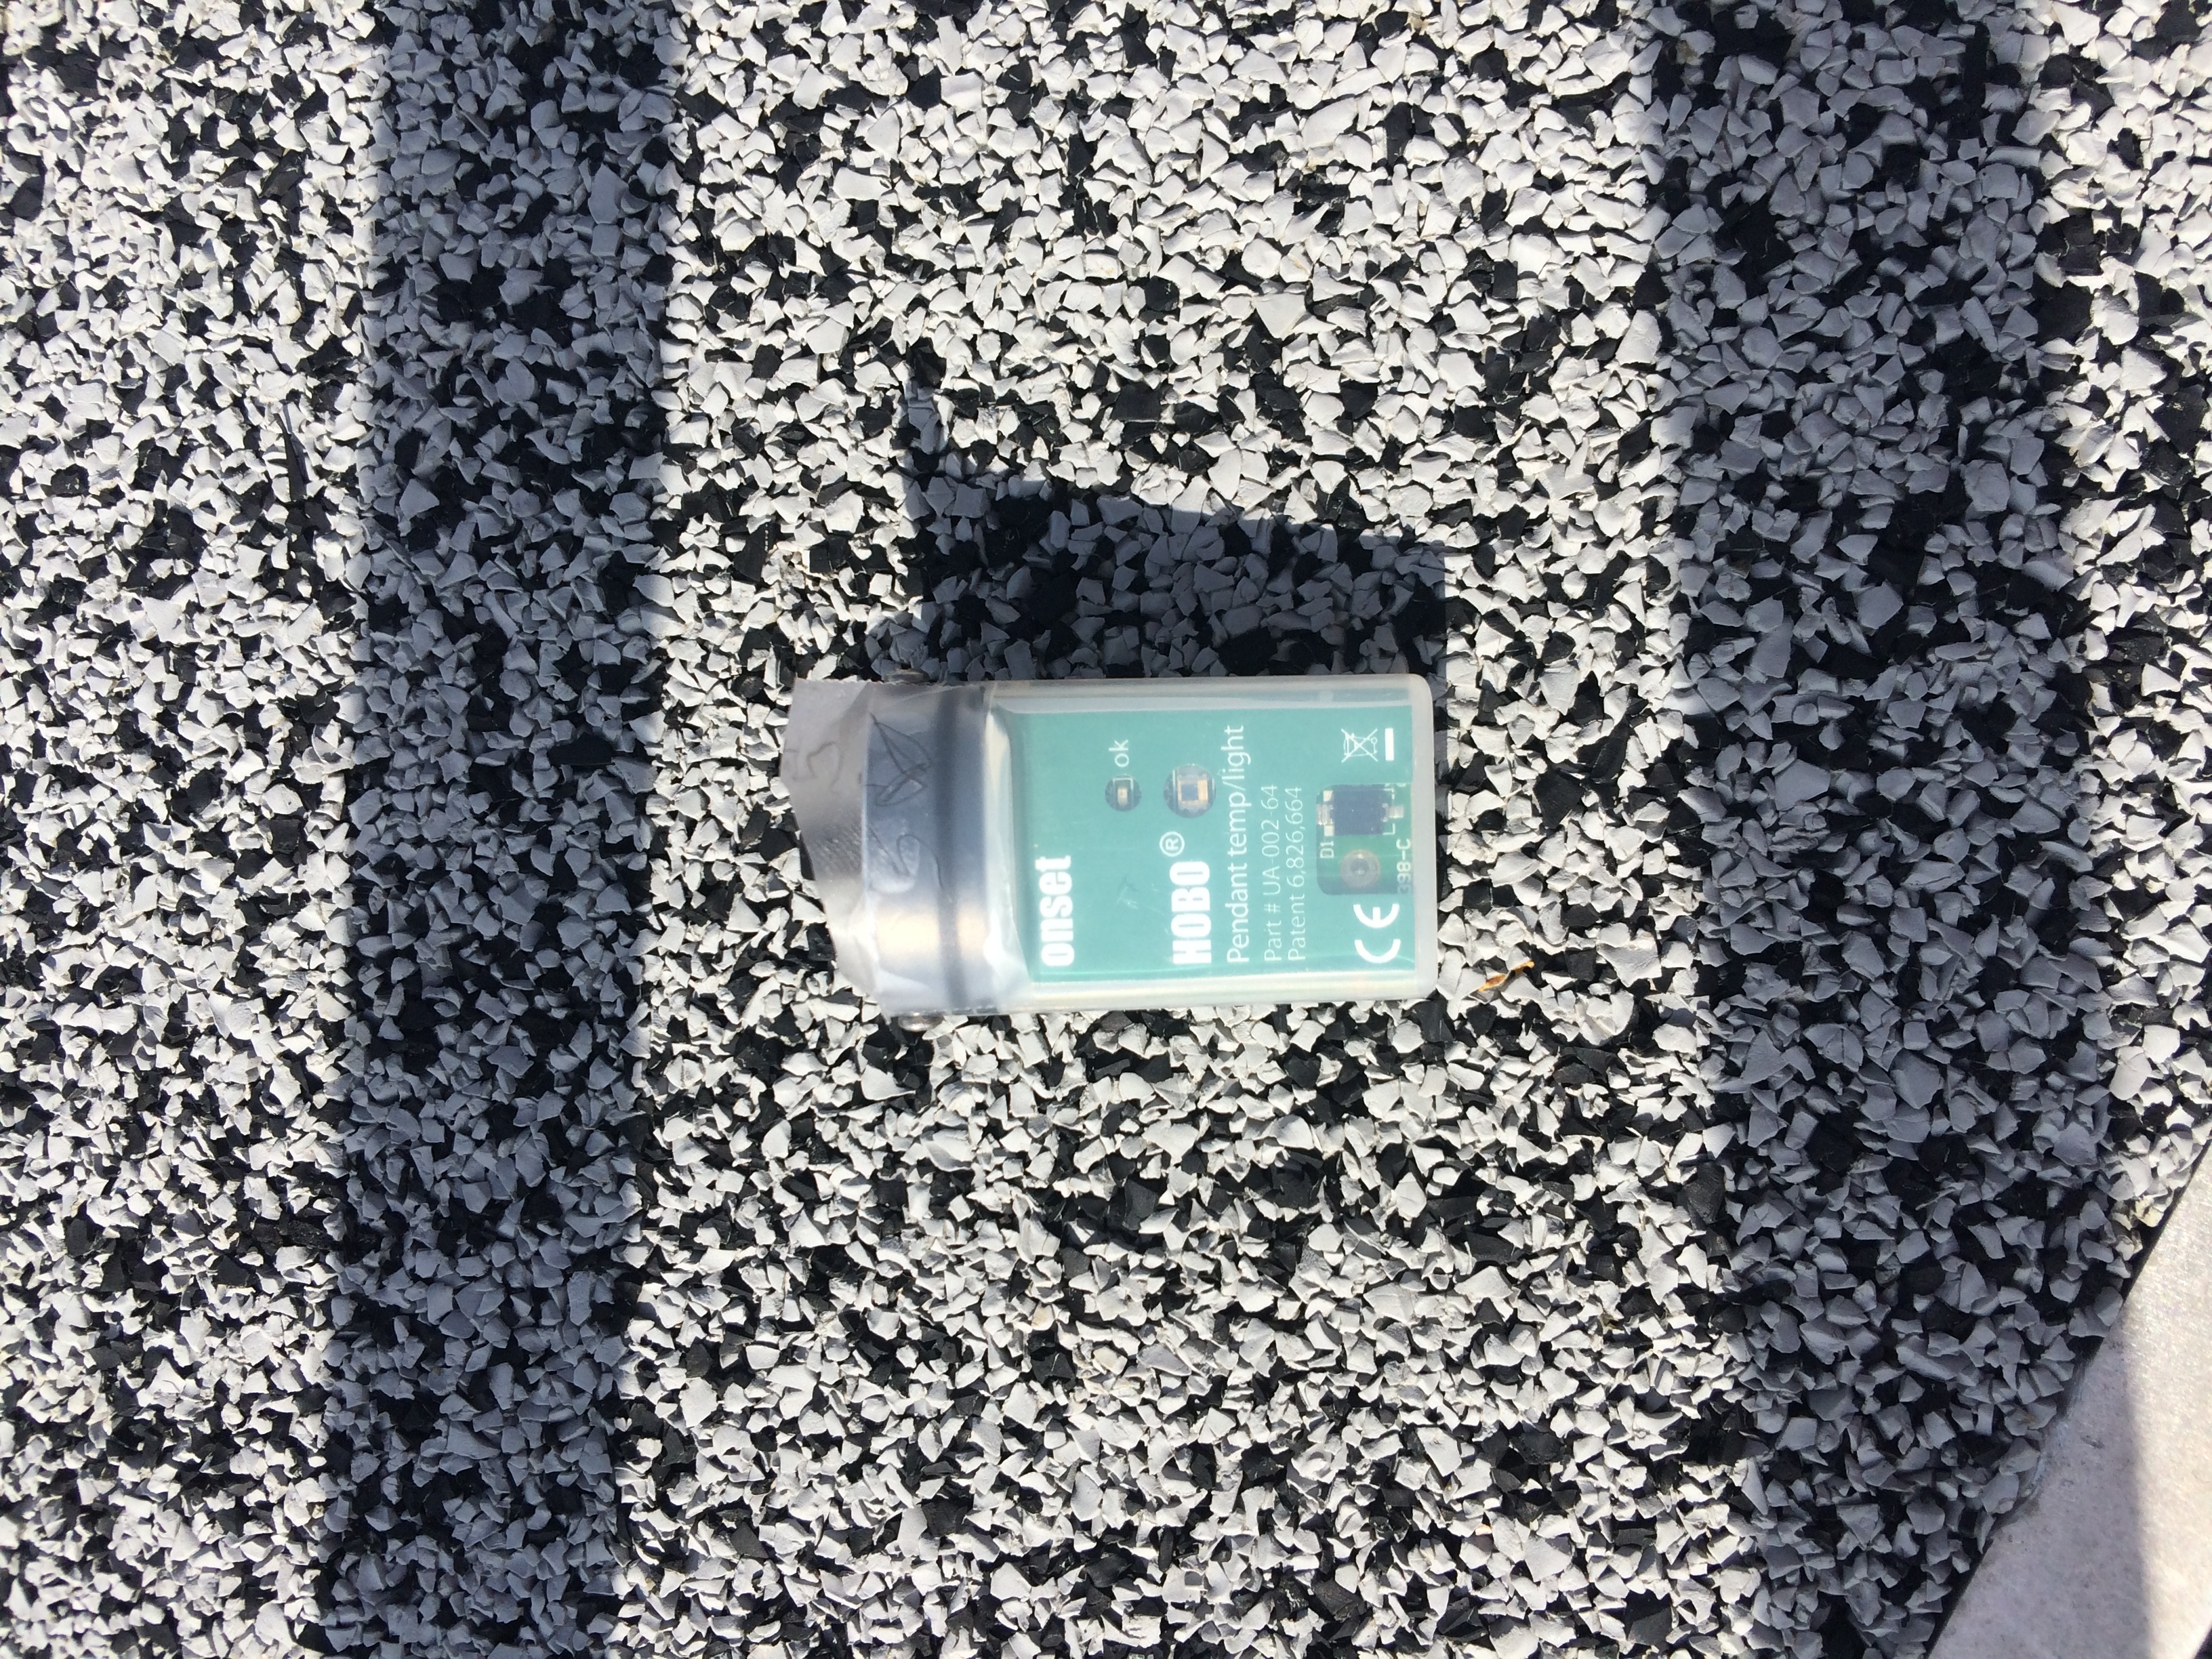

Data Logger (left) Data Collection Sheet (right)
Following this data collection, scientists then went out to each site and collected the animals found in each community. They placed them in containers for collection in which they are now identifying, counting, and measuring each of the animals.
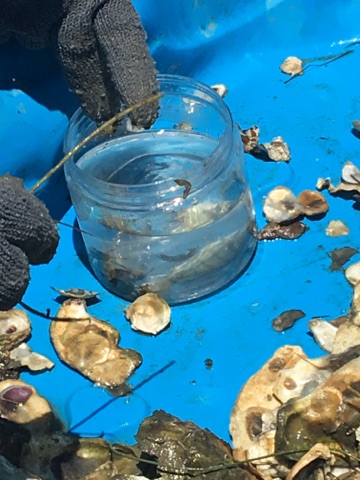
Top Left: Scientists begin removing animals from containers.
Top Right: Scientists sift through the containers to find the animals.
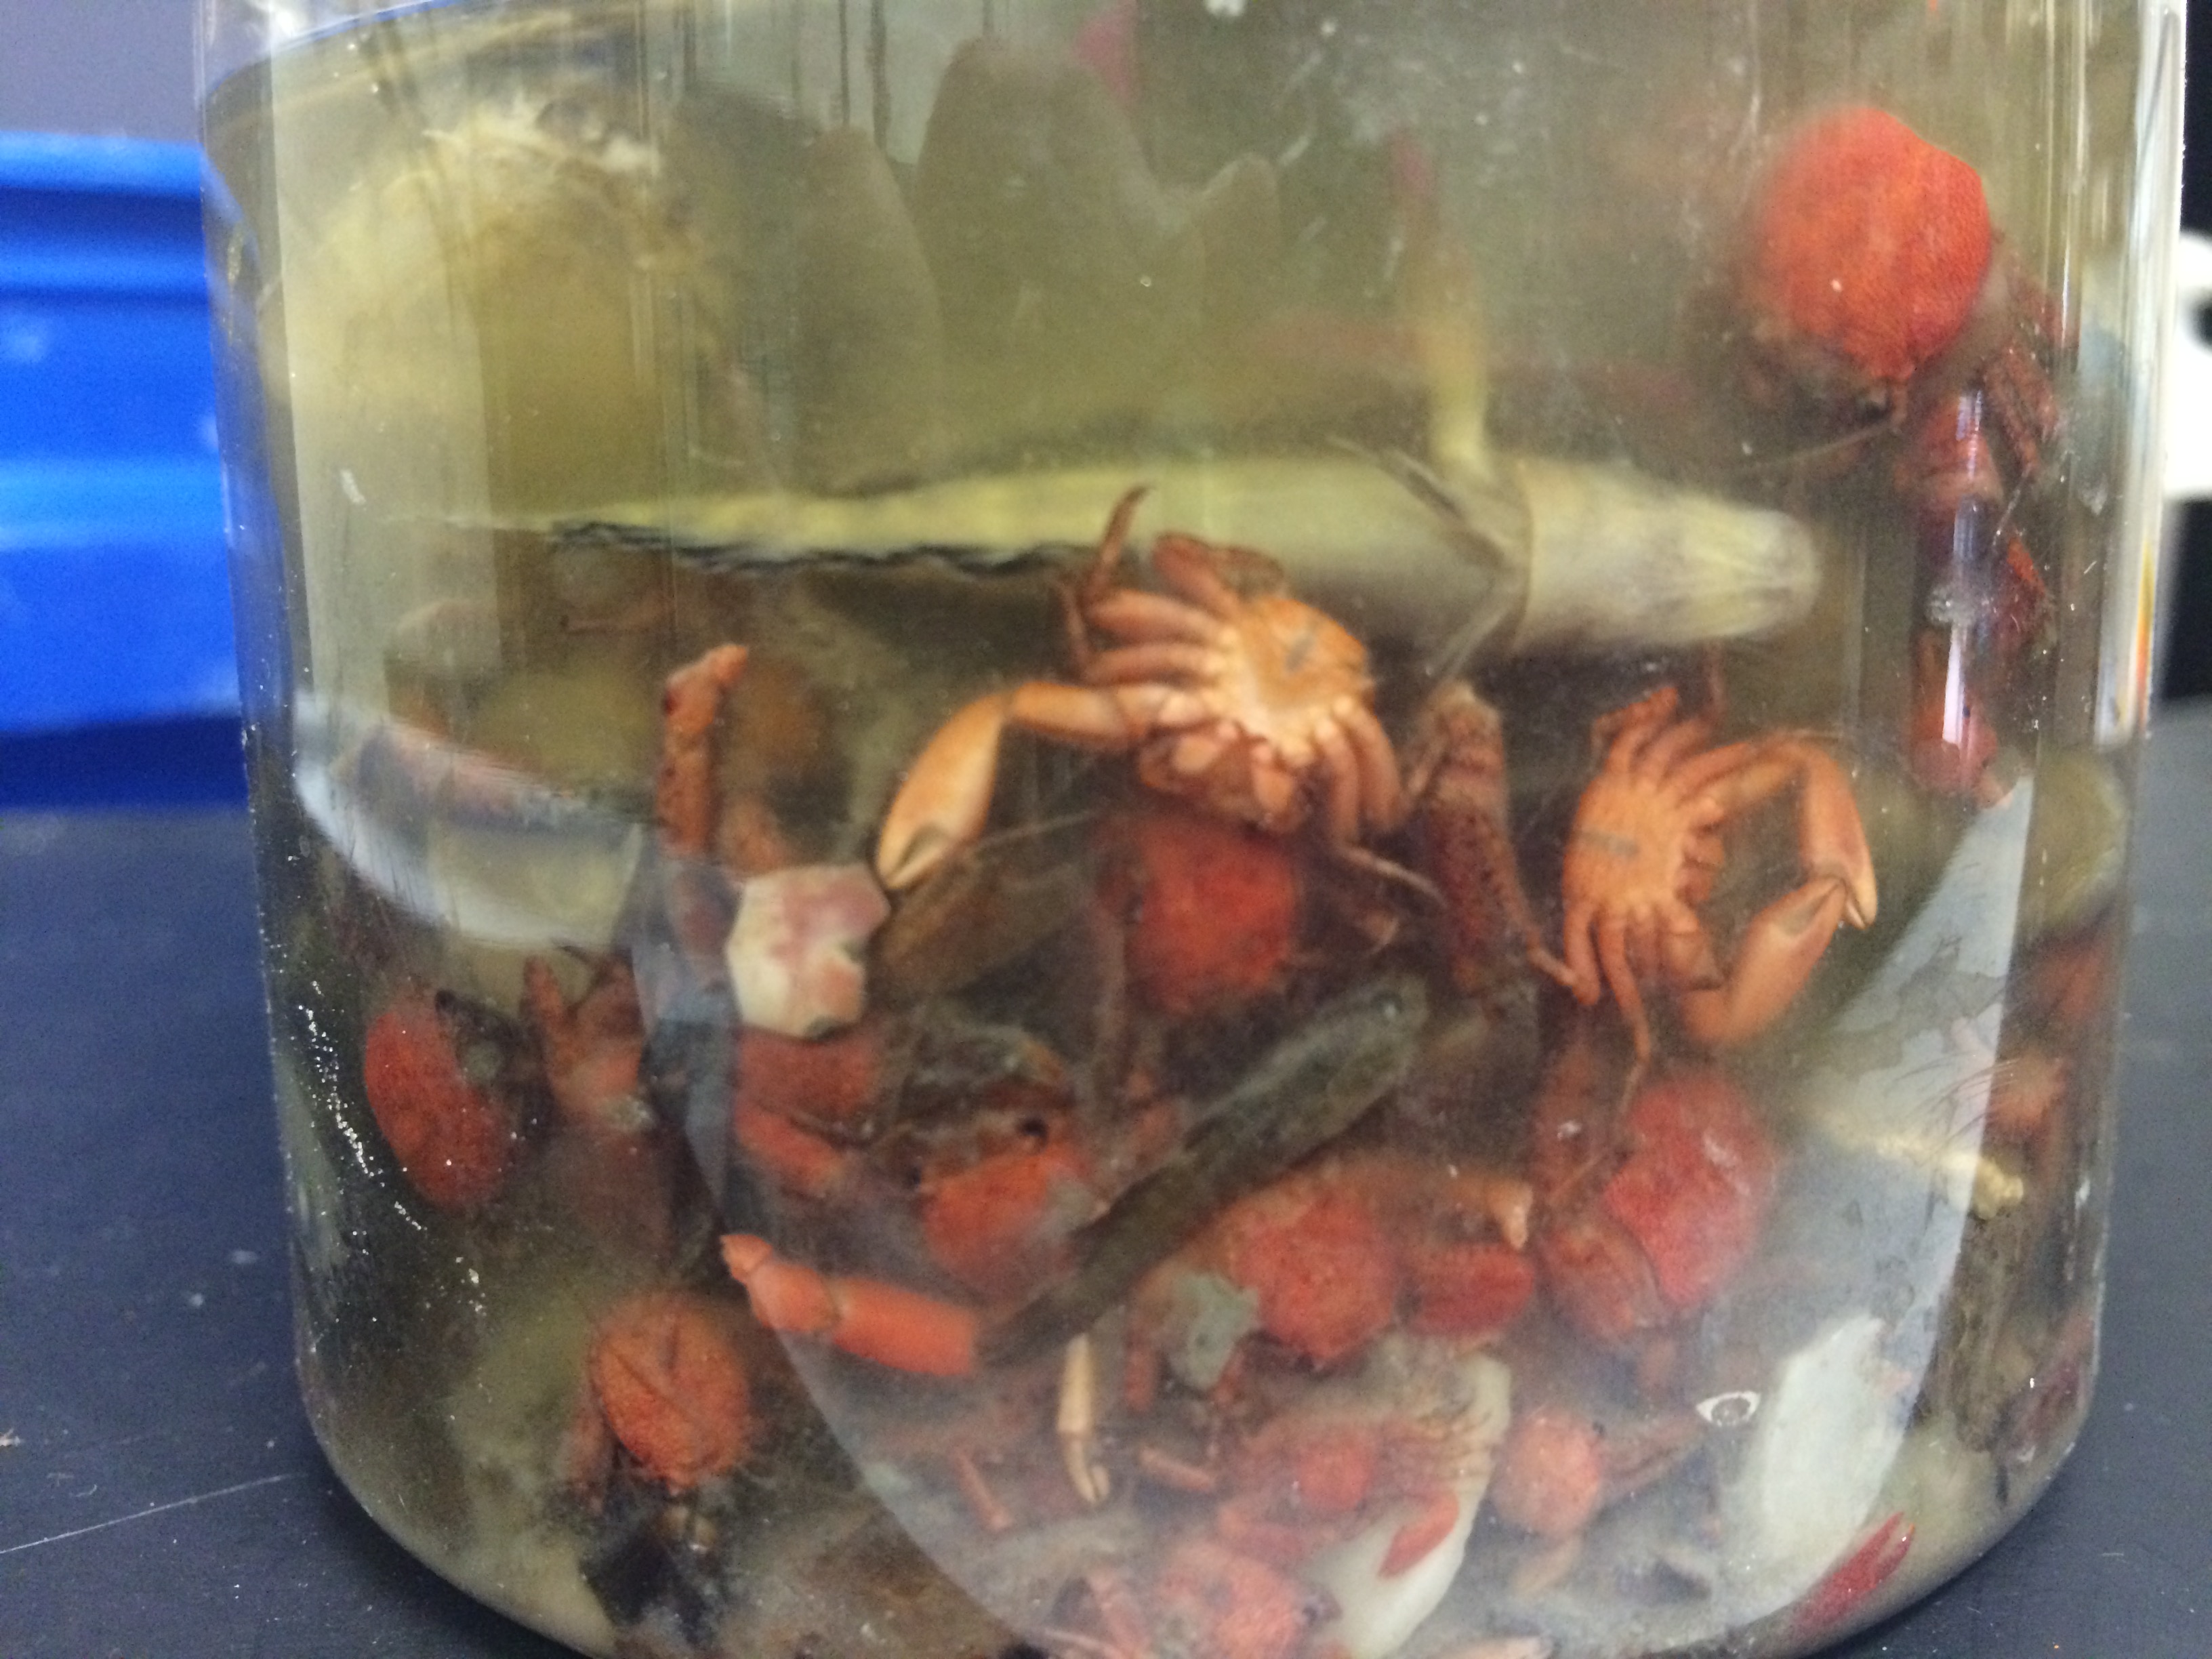
Bottom Left: Scientists place animals found in the community into jars for future sorting.
Results
This investigation is actually a continuance of an investigation started last summer. Data from the previous investigation suggested that more fish were in the communities with clear water and a larger amount of blue crab were found in the communities with turbid water.
At the time of this entry, the scientist has sorted through 14 out of 85 collection samples. He has found a significantly larger amount of oyster settlement in small mesh cages than large mesh and open cages.
Discussion
Based on the data collected so far, it seems that the small mesh cages keep out predators, allowing oyster communities to grow significantly. This could mean that scientists have found a way to help establish large oyster communities to improve water quality.
Also, fish tend to be the main predators in clear water. Scientists believe this is because fish rely on their sense of sight to catch prey. Blue crab tend to be the main predators in turbid water. This is because blue crabs rely on their sense of smell to catch prey. If we want to keep more fish in the bay in order to help with commercial fishing, turbid waters would negatively affect this. The scientist expects that he will find similar results during this investigation.
Lesson Plan
5E Lesson Plan:
Scientific Tools: Measuring with a Secchi Disk ˈ/sekē ˌdisk/
Enduring Understandings:
- Key Concept 1: Descriptive investigations help us observe our world. We can ask questions, make predictions, and use scientific tools to conduct an investigation.
- Key Concept 2: Scientists collect information by observing what happens and using tools to measure their observations. Scientists use their results, or data, to form graphs and conclusions to explain their discoveries. Scientists are able to observe and analyze patterns in their data so they can explain what they learned to others.
- Key Concept 3: Once they form a conclusion, scientists can then share it with others through talking about it or through showing people their graphs and charts.
Essential Questions:
- How can we conduct investigations of the natural world?
- What tools can we use to collect data?
- How can we analyze data to form conclusions?
TEKS:
(2) Scientific investigation and reasoning. The student uses scientific inquiry methods during laboratory and outdoor investigations. The student is expected to:
(A) plan and implement descriptive investigations, including asking and answering questions, making inferences, and selecting and using equipment or technology needed, to solve a specific problem in the natural world;
(B) collect data by observing and measuring using the metric system and recognize differences between observed and measured data;
(C) construct maps, graphic organizers, simple tables, charts, and bar graphs using tools and current technology to organize, examine, and evaluate measured data;
(D) analyze and interpret patterns in data to construct reasonable explanations based on evidence from investigations;
(4) Scientific investigation and reasoning. The student knows how to use a variety of tools and methods to conduct science inquiry. The student is expected to:
(A) collect, record, and analyze information using tools, including microscopes, cameras, computers, hand lenses, metric rulers, Celsius thermometers, wind vanes, rain gauges, pan balances, graduated cylinders, beakers, spring scales, hot plates, meter sticks, compasses, magnets, collecting nets, notebooks, sound recorders, and Sun, Earth, and Moon system models; timing devices, including clocks and stopwatches; and materials to support observation of habitats of organisms such as terrariums and aquariums;
Materials needed for lesson:
- Slideshow with pictures
- Poster paper/markers
- 2 inch circles made from yogurt container lids
- Washers
- String
- Sharpie
- 1000 mL beakers of water
- Instant coffee and scoops/spoons
- Measuring tape in cm.
- Secchi disk information sheet
- Lab Recording sheet
Vocabulary:
Secchi disk, turbidity, inference
Engage (5 minutes):
Show students the slideshow showing pictures of the oyster experiment. The focus was to see how predators were affecting the oysters in our bays. (Pictures will include oysters, data recording sheets, etc.)
Explore (10 mintues):
Give each group a secchi disk. Tell them that this is one of the tools that used while in the field. Tell students that they are to first write down all of their observations about the tool using Tweet Writing (this is where students use hashtags on poster paper with observations ex. #whiteandblack, #round, #pattern, #stringsAREattached). Hang the poster papers around the room and discuss what each group wrote. Now, tell students to talk as a group and make and INFERENCE about what they think this tool was used for in the field. They are to write that as one large Tweet across the bottom of their poster paper (ex. #findingoysters, #measuringlight).
Explain (5 minutes):
Give students the information sheet about secchi disks. Read through and have students highlight or underline important or new information. Show students pictures of the teacher using the secchi disk in the field. Using the real secchi disk, demonstrate how it is used in the water and how to pinch the string at the depth where you can no longer see the pattern, then measure using centimeters on a measuring tape.
Elaborate (30 minutes):
- Students will create their own secchi disks using plastic lids from a yogurt container cut into 2 inch circles. The teacher will need to have these pre-cut and will poke a hole through the middle using a nail. Students will then draw a secchi pattern on the top of their circle using a sharpie. Next, students will thread a string through the hole and tie a washer to the end of it to use as a weight. Make sure to leave at least 60 centimeters of string above the disk.
- Students will use their mini secchi disks to measure the “turbidity” of their water samples. The students will have 3 samples in small buckets to study or beakers that hold at least 1000 mL of water. One beaker will have clear water. The second beaker will have 5 scoops of instant coffee. The third beaker will have 15 scoops of instant coffee. Students will measure the Secchi depth in each beaker 3 times and record on recording sheet.
Evaluate (20 minutes):
Put each of these questions on the top of a poster paper and post around the room. Have about 4-5 students per question. Then have students read the question, discuss and write their answer. After 5 minutes, have them switch to the next question. They will read the last groups answer and either add to it or draw a check mark next to it if they agree. Repeat for each question:
- If you were on a boat in the ocean using a Secchi disk, how would your data collection table look different from the one you created today?
- How did the Secchi Depth measurements change with the addition of more “mud and pollution”?
- How do you think turbidity (the cloudiness of the water) might affect the amount of light that will pass into the water for photosynthesis by marine plants?
- What does this mean in a real world setting, and how might turbid water affect the animal life?
- What can be done to improve the water quality in the ocean?
Secchi Disk Lab
Record your measurement data in this chart.
| Type of Water | Time | # Scoops of Coffee | Secchi Depth (cm) |
| Clear Water | |||
| Brown Water | |||
| Dark Water |
Use your data from the chart to create a bar graph.
What is one conclusion you can draw from this data?
_______________________________________________________________________
_______________________________________________________________________